
📊 Full opportunity report: Bitcoin Battles Unfold in Live Warzone Visualization on ThorstenMeyerAI.com — validation score, market gap, and execution plan.

Get the latest gadgets delivered free with Prime
- Fast, free delivery on millions of items
- Prime Video, Amazon Music and more included
- Member-only deals all year
TL;DR
A novel online visualization called Bitcoin War displays live BTC/USDT trades as a cinematic battlefield. It offers an immersive, real-time view of market activity, emphasizing chaos without trading capabilities.
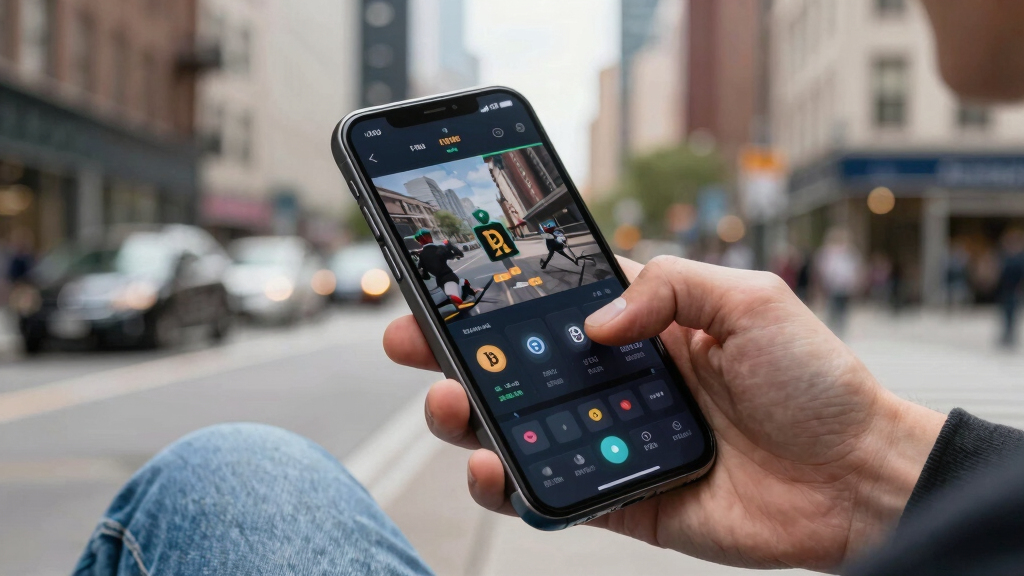
Bitcoin War, a browser-based visualization tool, has been launched to depict real-time BTC/USDT trades as a dynamic battlefield scene. Developed by isbitcoindead.com, this project transforms market data into an immersive visual experience, emphasizing the ongoing tug-of-war between buyers and sellers. The visualization is accessible instantly in any modern browser and aims to provide a visceral view of market activity, separate from trading or investment advice.
The visualization connects directly to Binance’s public WebSocket trade stream, with a fallback to Coinbase, ensuring continuous data flow. Each trade is represented as a combatant—buy orders from the Cobalt Host push the front line from the left, while sell orders from the Ember Legion counter from the right. Large liquidations are visualized as airstrikes, adding to the warlike aesthetic. The entire setup uses Canvas 2D graphics, WebAudio synthesis, and real-time stream processing, all client-side, with a minimal footprint of approximately 180KB.
Features include an automatic camera that shifts perspectives between broad views and detailed skirmishes, a live DEFCON meter indicating market volatility, a scrolling war log narrating ongoing conflict, and a synthetic soundtrack generated within the browser. A comprehensive scoreboard tracks seconds won, casualties, and territorial gains in dollars, creating a compelling narrative of market dynamics. Importantly, the project emphasizes that it is not a trading tool; it does not involve wallets, signals, or investment advice, but solely offers a creative visualization of market activity.
Visualizing Market Chaos Through Web Technology
This project demonstrates how advanced web technologies can be harnessed for artistic and data visualization purposes, offering a new way to interpret market volatility. It provides a visceral, engaging perspective on Bitcoin trading that could appeal to tech enthusiasts, artists, and analysts alike. While not a trading platform, it underscores the raw chaos and competitive nature of markets, making complex data accessible through immersive visual storytelling.
Products Worth Considering

Amazon Kindle Paperwhite (2024), 16 GB, 7-inch Display, Black

DJI Osmo Mobile 8 Standard Combo Phone Gimbal Stabilizer

Bose TV Speaker Compact Soundbar with Bluetooth and HDMI-ARC, Black
As an affiliate, we earn on qualifying purchases.
Innovative Web Tech Meets Market Data
The Bitcoin War visualization is part of a growing trend of using web-based graphics and real-time data streams to create immersive experiences. It builds on existing market visualization tools but distinguishes itself by turning live trade data into cinematic warfare, emphasizing chaos and competition. The project is a showcase of browser capabilities, including Canvas, WebAudio, and WebSocket technology, all running client-side without backend infrastructure.
It was developed by isbitcoindead.com and launched in early 2024, aiming to provide a unique, artistic lens on Bitcoin market activity. The project explicitly states it is for entertainment and artistic expression, not for trading or investment decisions.
“Bitcoin War transforms real-time trades into a visceral battlefield, emphasizing chaos over clarity.”
— an anonymous researcher
Details on Data Accuracy and Future Updates
It is not yet clear how accurately the visualization reflects real market conditions or whether future updates will include additional features. The project emphasizes artistic representation rather than analytical precision, and the extent of its real-time responsiveness or scalability remains to be seen.
Potential Expansions and Community Engagement
Developers may enhance the visualization with more detailed analytics, user customization, or integration with other data sources. Community feedback could influence future iterations, and the project might inspire similar creative visualizations of financial markets. The team has indicated plans to keep the platform free and accessible, with ongoing improvements likely.
Key Questions
Is Bitcoin War a trading tool?
No, Bitcoin War is purely a visual art project that depicts real-time trade data as a cinematic battlefield. It does not involve wallets, trading signals, or investment advice.
How does the visualization work technically?
It uses WebSocket streams from Binance with a fallback to Coinbase, rendering real-time trades with Canvas 2D graphics, WebAudio for sound, and client-side processing to create an immersive war scene.
Can I customize the visualization?
Currently, the project is designed as a fixed visualization accessible via the website. Future updates may include customization options, but none are confirmed at this time.
Is this visualization accurate or reliable?
It reflects live trade data but is intended as an artistic interpretation, not an analytical or predictive tool. Its accuracy in depicting market conditions is limited to visual representation.
Where can I see the visualization?
You can experience it instantly at war.isbitcoindead.com.
Source: ThorstenMeyerAI.com